TBAWMN
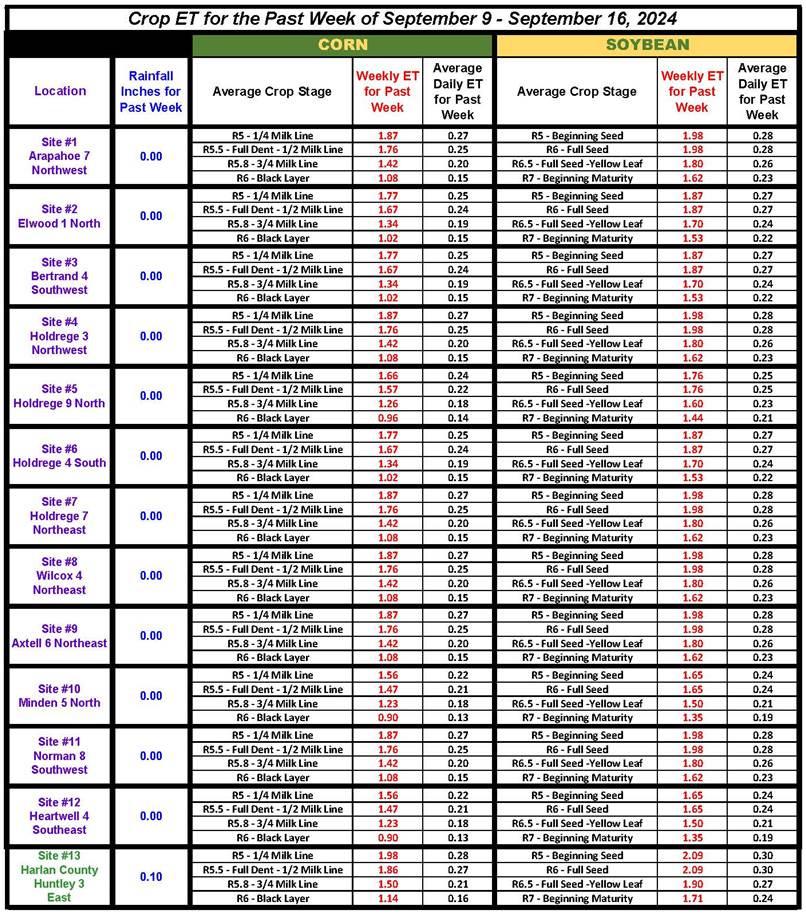
Past Weeks Crop Water Use (ET)
1. Select the site location closest to your field.
2. Select the average crop stage for your field during the past week as dated on the chart.
3. You can see the weekly average and the daily average Crop Water Use.
Predicting Upcoming Weeks ET (Crop Water Use)
1. Select the site location closest to your field.
2. Select the average crop stage your crop will be for the upcoming week.
3. Make note of what the average Crop Water Use was this past week for your upcoming weeks crop stage.
4. Knowing what the weather was this past week and knowing what the weather forecast is for the upcoming week, you can predict an estimated Crop Water Use for the upcoming week.
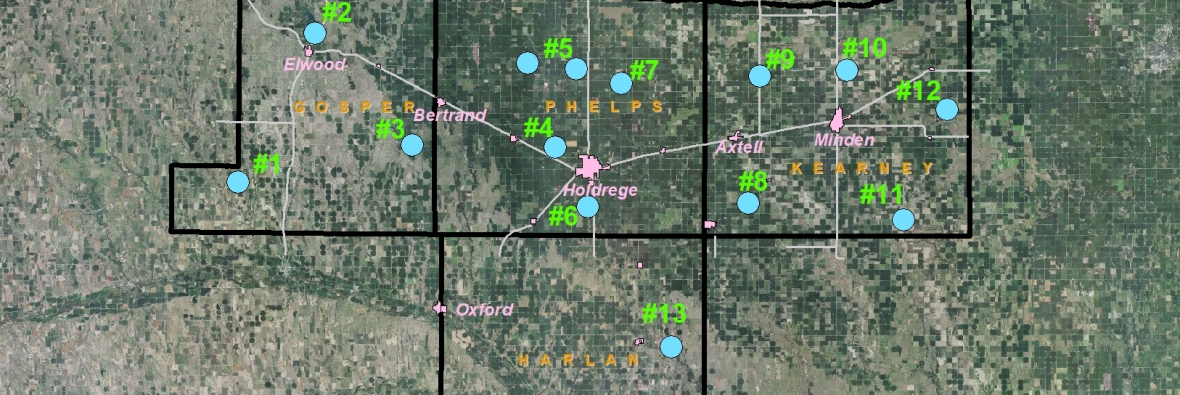
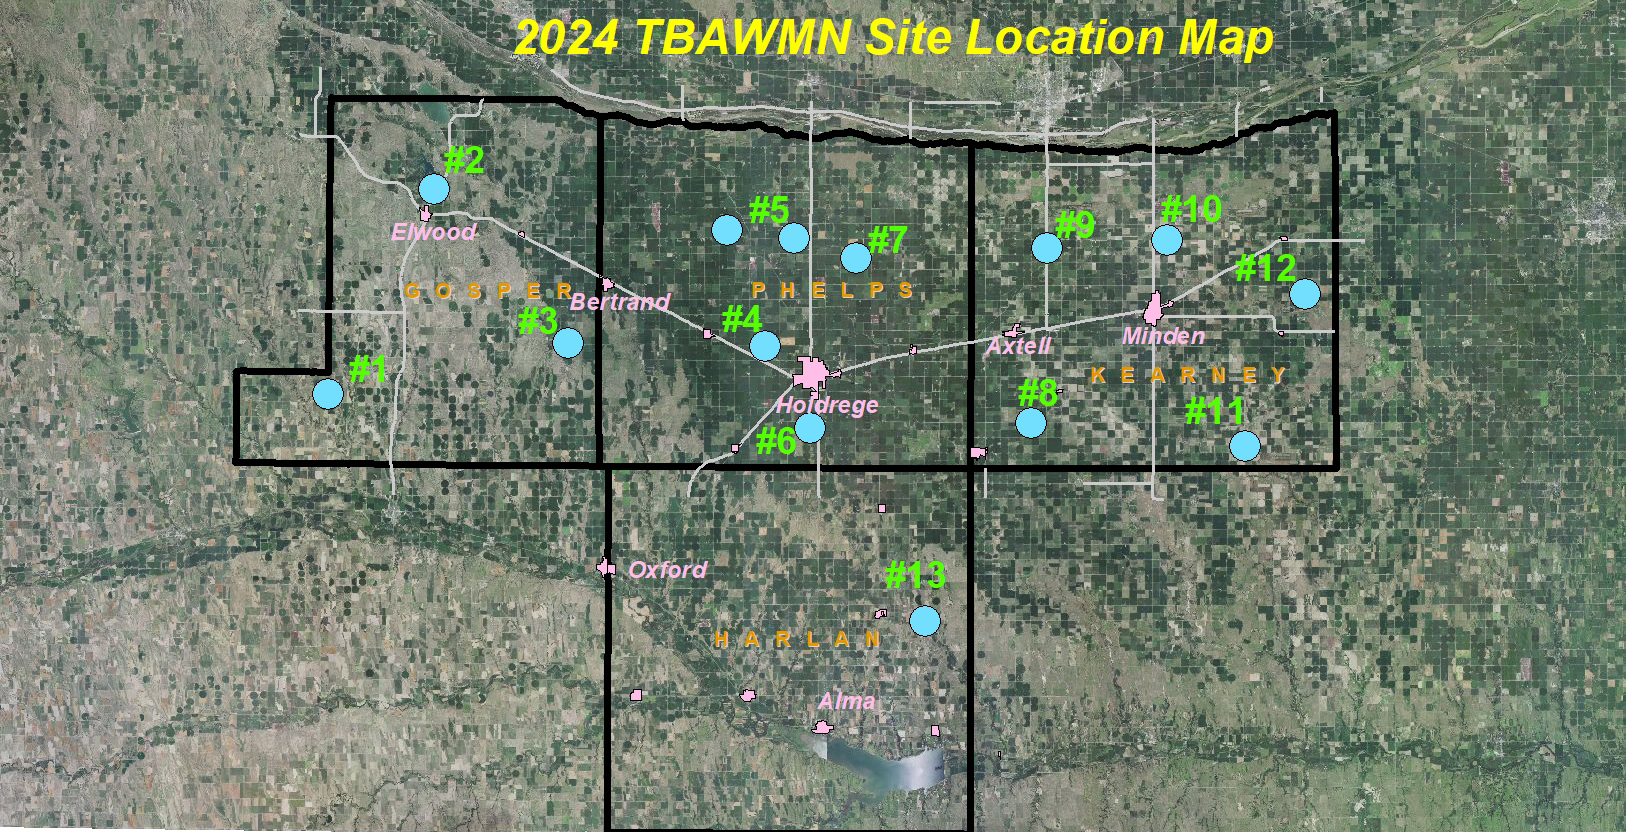
Below are the Crop ET’s for the week indicated on the chart. These ET’s come from atmometers located across the Tri-Basin NRD plus one in Harlan County. See map.
These locations are in addition to the High Plains Regional Climate Center weather stations.
Additional Crop ET Data
UNL Growing Degree Days & Evapotranspiration Data